Body Fat Male Ranges by Age: How to Measure and Read It
Body fat male ranges by age explained: how calipers, DEXA and bioimpedance measure it, and what your results mean for long-term health risk.

In 2024, 45% of adults aged 18 and older, about 2.6 billion people, were overweight, including about 940 million adults living with obesity, or 16% of all adults, according to the World Health Organization. Men represented 44% of the world's adult overweight population. The share classified as overweight rose from 25% in 1990 to 45% in 2024, and worldwide obesity prevalence more than doubled. That same screening treats a BMI of 25 or higher as overweight and a BMI of 30 or higher as obesity, and it is not a direct body-fat percentage.
A body fat male result belongs in that larger picture. Two men can share a scale weight and still carry different amounts of fat, in different places, with different metabolic consequences.
Why Body Fat in Men Needs More Than a Scale Reading
BMI is weight in kilograms divided by height in meters squared. It works like a city name on a map. It places someone in a rough region, and it does not give a street address. Population surveillance uses it because height and weight are easy to standardize. It cannot separate fat from muscle, and it cannot show whether fat sits under the skin or deep in the abdomen.
A muscular man can land in a high BMI category with little excess fat. A man with a BMI inside the screening range can still carry substantial abdominal fat and a higher cardiometabolic load. Age, ethnicity, medical history, and medicines change how the same weight should be read. That is why a clinic visit that stops at the scale leaves the important question unanswered.
The useful question is whether three signals point the same way.
- Body-fat percentage: an estimate of adipose tissue relative to total mass, tied to the device and the day it was taken.
- Waist circumference: a practical stand-in for central fat, measured at the same landmark every time.
- Metabolic markers: blood pressure, glucose or HbA1c, triglycerides, and HDL cholesterol.
Read together, those measures show whether weight change is fat loss, fluid, or lean tissue. Age-banded reference ranges come next, then measurement methods, fat location, trend reading, and the levers that change composition without treating the scale as the only score.
Healthy Male Body Fat Percentage Ranges by Age
Reference bands are categories, not pass-or-fail diagnoses. Essential fat, about 2-5%, supports nerves, hormones, and organs and is not a long-term target. Athletic and fitness bands sit lower because training and lower fat mass often travel together. Average describes many healthy men who are not training for sport. A higher level marks a point where central fat and metabolic markers deserve a closer look, not an automatic label.
Bands sit higher with age because fat mass tends to rise and muscle mass tends to fall across adulthood. A percentage that looks high next to a 25-year-old can be ordinary at 70. Sources also disagree because they study different people, devices, and outcomes. ACSM materials cite roughly 10-22% as a healthy male range, while other professional criteria use 18-24%. Research has associated DXA-measured body fat above 15.3% in men with at least two cardiometabolic abnormalities. Method and fat distribution change the meaning of the same percentage.
| Category | Ages 20-39 | Ages 40-59 | Ages 60 and older |
|---|---|---|---|
| Essential fat | 2-5% | 2-5% | 2-5% |
| Athletic | 6-13% | 8-15% | 10-16% |
| Fitness | 14-17% | 16-20% | 17-21% |
| Average | 18-24% | 18-24% | 22-25% |
| Elevated | 25% and above | 25% and above | Above 25% |
Say a 45-year-old man measures 23%. He sits in the average band for his age, and he would also sit in the average band used for younger men under the 18-24% criterion. His waist, blood pressure, and glucose decide whether that number signals risk. A muscular build can push BMI up without matching adiposity. A soft midsection can do the opposite.
BMI screening and direct fat estimates do not rank men the same way. In NHANES, August 2021-August 2023, 39.2% of U.S. men aged 20 and older had obesity, defined as a BMI of at least 30. That figure is a screening statistic, not a body-fat percentage. In the 2024 HUNT4 study of 22,191 healthy Norwegian adults, obesity prevalence was 41.2% by body-fat percentage and 17.3% by BMI.
Practical rule: Find the age band, then ask whether waist and metabolic markers point the same direction as the percentage.
Calipers, DEXA and Bioimpedance Compared
Choosing a body-composition method is like choosing a ruler versus a surveyor's instrument. Both can be honest. They answer different jobs, and mixing them across weeks creates false change.
| Method | How it works | Typical error | Best use | Main limitation |
|---|---|---|---|---|
| Skinfold calipers | Pinch subcutaneous fat at three or seven sites and convert with an equation | About 3-4% with a trained tester; more with inexperienced testers | Low-cost tracking by one consistent tester | Operator-dependent; less accurate in obesity |
| Bioelectrical impedance (handheld or smart scale) | Sends a low current and estimates composition from resistance | About 3-5%; larger when dehydrated | Daily or weekly trend tracking | Hydration, meals, exercise, and time of day shift readings |
| DEXA | Dual-energy X-ray separates fat, lean tissue, and bone | About 1-2% against reference methods; low radiation dose | Clinical baseline and longitudinal trends | Cost and facility access; regional fat detail varies by report |
| Hydrostatic weighing | Compares weight in air with weight underwater | About 1.5-2% when exhalation is complete | Research settings | Requires full exhalation and a specialized tank |
| Air displacement (BOD POD) | Measures body volume by air displacement | About 2-3% under standard clothing protocols | Research and athletic testing | Cost; clothing and hair can affect results |
| Waist circumference | Tape at the iliac crest or navel, same position each time | Low with a trained measurer | Screening central fat risk | Does not produce a body-fat percentage |
What each method is actually for
Calipers are inexpensive and repeatable when one trained tester owns the technique. Accuracy falls when testers rotate, when sites are guessed, or when obesity makes skinfolds hard to lift. They see subcutaneous fat, not the fat around organs.
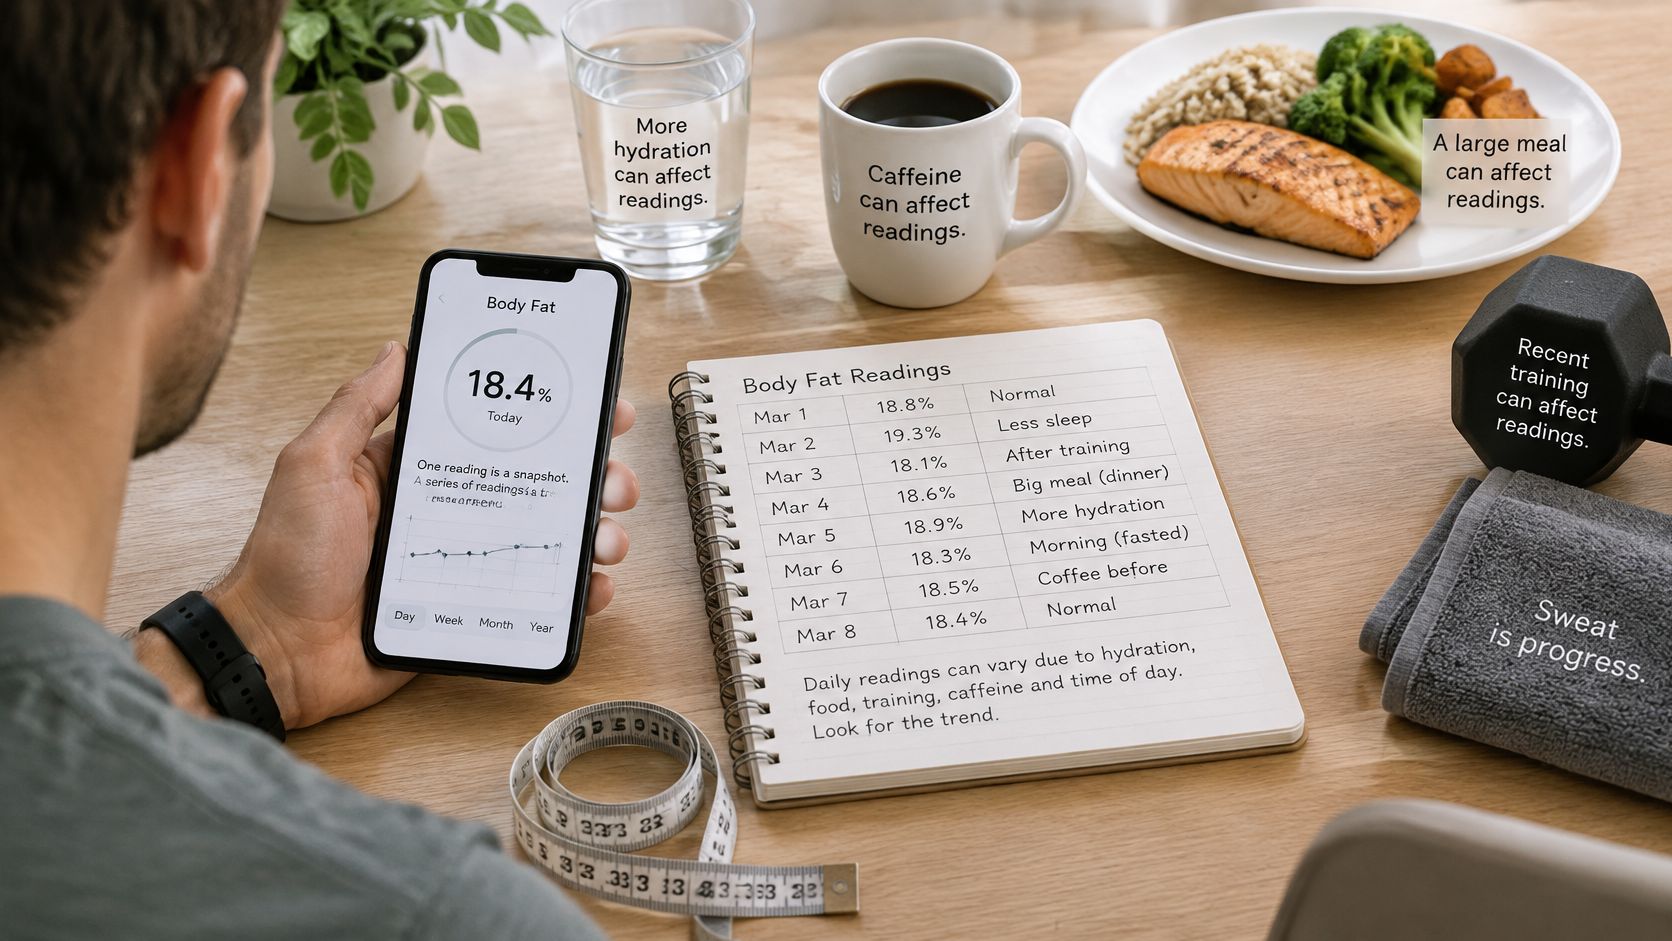
Bioimpedance fits a weekly log because the device is in the home. It is a poor judge of a single morning. Dehydration raises the fat estimate. A large meal, a hard workout, caffeine, and a late reading can move the number by several points without any real change in fat mass.
DEXA is the strongest routine clinical baseline. It separates fat, lean soft tissue, and bone at a low radiation dose. It costs more, it needs a facility, and two centers can report regional fat differently. Use it to anchor a trend, not to chase a tenth of a percent.
Hydrostatic weighing and air-displacement systems stay mostly in research and sport labs. They demand strict technique. Waist circumference needs only a tape, and it is often the measure that changes the care plan.
A protocol that keeps the noise down
Use the same method, the same device, and the same time of day. Match hydration, note the last meal and the last workout, and write the conditions beside every result. Compare a caliper week only with caliper weeks. Bring in DEXA when the home trend and the waist disagree, or when lean mass is the clinical question.
Where Fat Sits and Why Waist Size Changes Risk
Subcutaneous fat is padding under the skin. Visceral fat is packed around the abdominal organs, and that location is why it carries more metabolic weight. In men, visceral adipose tissue is only about 10-20% of total fat, yet it is independently associated with cardiometabolic disease, as described in this review of visceral adipose tissue. Two men with the same body-fat percentage can face different risk when one stores more of it centrally.
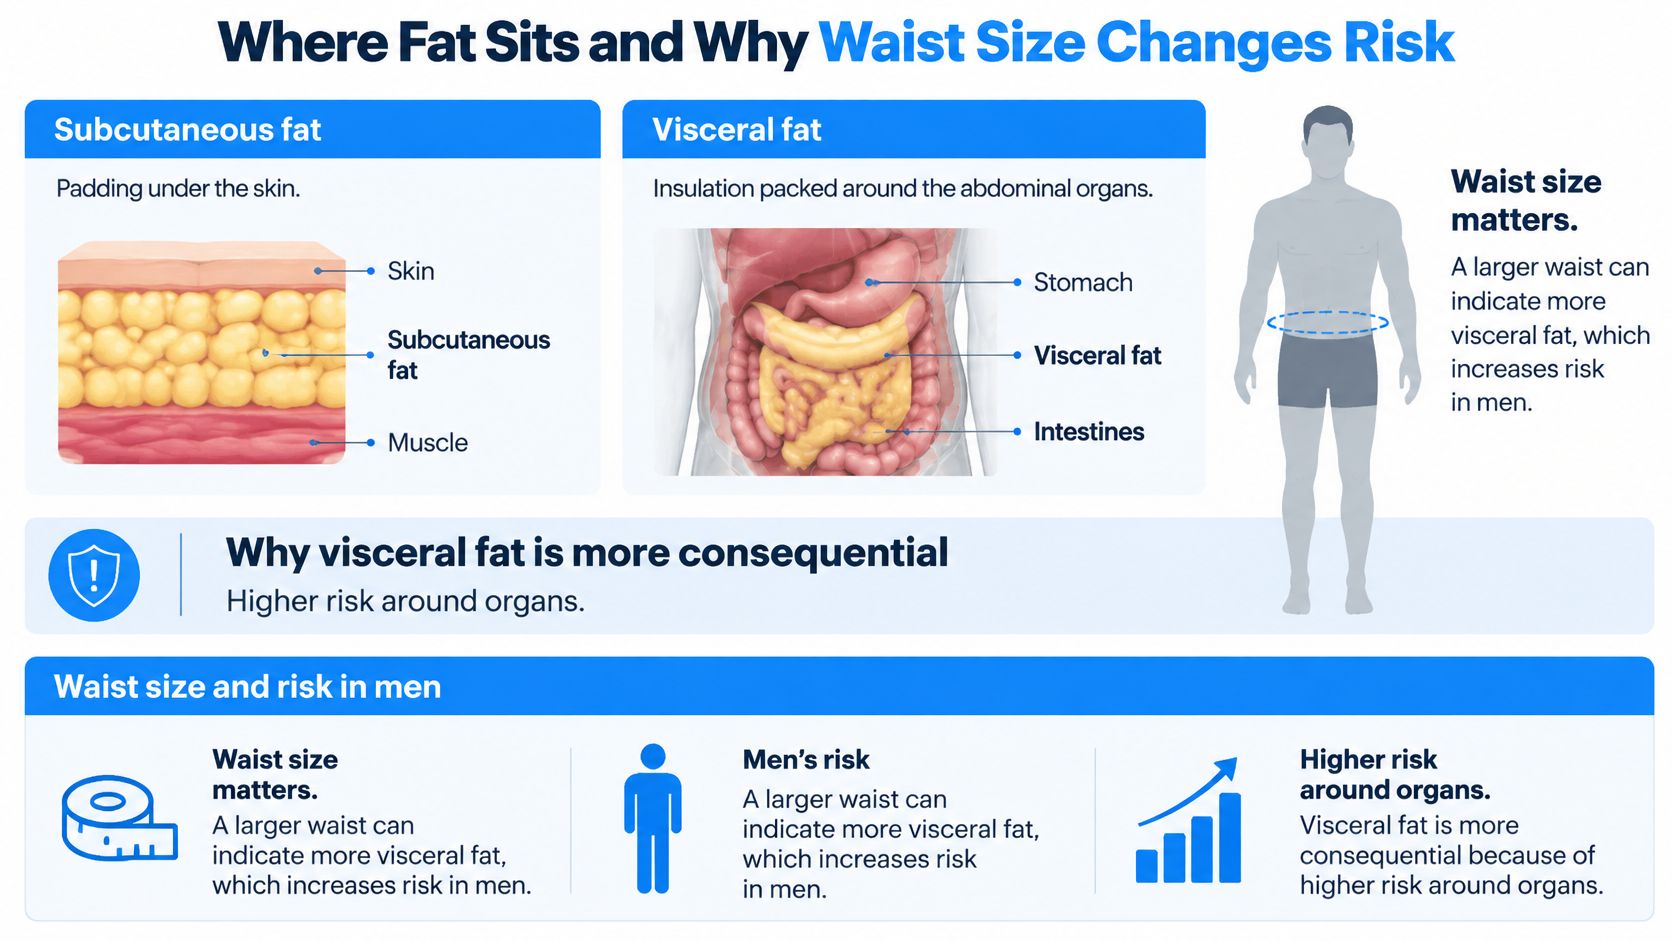
Enlarged visceral fat cells send more free fatty acids to the liver and promote inflammatory signaling. Downstream, that pattern lines up with hepatic insulin resistance, atherogenic dyslipidemia, higher blood pressure, and impaired glucose regulation. Total fat mass does not capture that pathway.
| Marker | Threshold for men | What it signals |
|---|---|---|
| Waist circumference (Harvard Health) | At least 40 inches | Marker of excess visceral fat |
| Waist circumference (ACSM) | About 100 cm (39.5 inches) at the iliac crest | High cardiometabolic risk |
| Waist-to-height ratio | Above roughly 0.5 | Screening signal for central adiposity |
| Waist-to-hip ratio | Higher abdominal girth relative to the hips | Added context beyond BMI and body-fat percentage |
Thresholds differ by organization and by ethnic group. A man below one cutoff can still sit above another. Waist change over months matters more than hitting an arbitrary low percentage.
Measure at the iliac crest or the navel, and never switch landmarks mid-program. Stand relaxed, exhale normally, and keep the tape level. Record the value on the same weekday morning. Pair that log with aerobic work, resistance training, sleep, diet quality, and, when a clinician recommends it, supervised medical therapy. Men who want a structured place to start can review how to improve metabolic health alongside the tape measure, not instead of it.
How to Read Results Without Misreading Them
A single reading is a snapshot. A month of readings is a trend. Hydration, a large meal, a recent training session, caffeine, and time of day can shift bioimpedance by several points. A two-point drop on a handheld device over one week can be noise.
Men with similar BMI or total body-fat readings can still carry very different metabolic risk when more fat sits in the abdomen. A study of 174 young physically active men found that waist circumference and waist-to-hip ratio were stronger independent predictors of body-fat percentage than BMI after adjustment. A man who looks normal weight, or who has an acceptable scale-derived fat reading, can still warrant attention when the waist is high. A muscular man with a high BMI may not have matching adiposity.
Patterns over about four weeks
| Scale trend | Waist trend | Likely meaning | Next check |
|---|---|---|---|
| Down | Down | Favorable fat loss | Repeat measurements monthly |
| Down | Flat | Possible lean-mass loss or too little fat loss | Check strength, protein intake, and a DEXA baseline |
| Flat | Down | Possible recomposition | Compare strength and the training log over time |
| Up | Up | Fat gain or a fluid shift | Repeat under standard conditions; discuss with a clinician |
No row is a verdict from one morning. A falling waist with a flat scale can mean fat left while muscle stayed, and the training log is the tie-breaker. If loads are stable and recovery is intact, recomposition is a fair reading. If strength is sliding, treat the flat waist-to-scale story with more caution and look at intake.
Waist carries the most weight when the scale and the percentage disagree. Waist-to-hip ratio helps when those two already conflict, because it asks whether the abdomen is large relative to the hips. It still is not a diagnosis by itself.
A four-week log that can be compared
Measure on waking, after voiding, before food, in a similar hydration state. Use the same device or the same tape. Write the number, the device, sleep, and whether the prior day included a hard session or a unusually salty meal. After four weeks, decide from the direction of waist, scale, and strength together. Ignore one-day swings that line up with travel, alcohol, or a late weigh-in.
Apparent short-term change is often measurement noise. The decision belongs to the trend.
Strategies That Change Composition Without Costing Lean Mass
Fat loss that strips strength is a poor trade. The scale cannot show that split. These levers are ranked by how directly they protect lean tissue while fat, especially central fat, comes down.
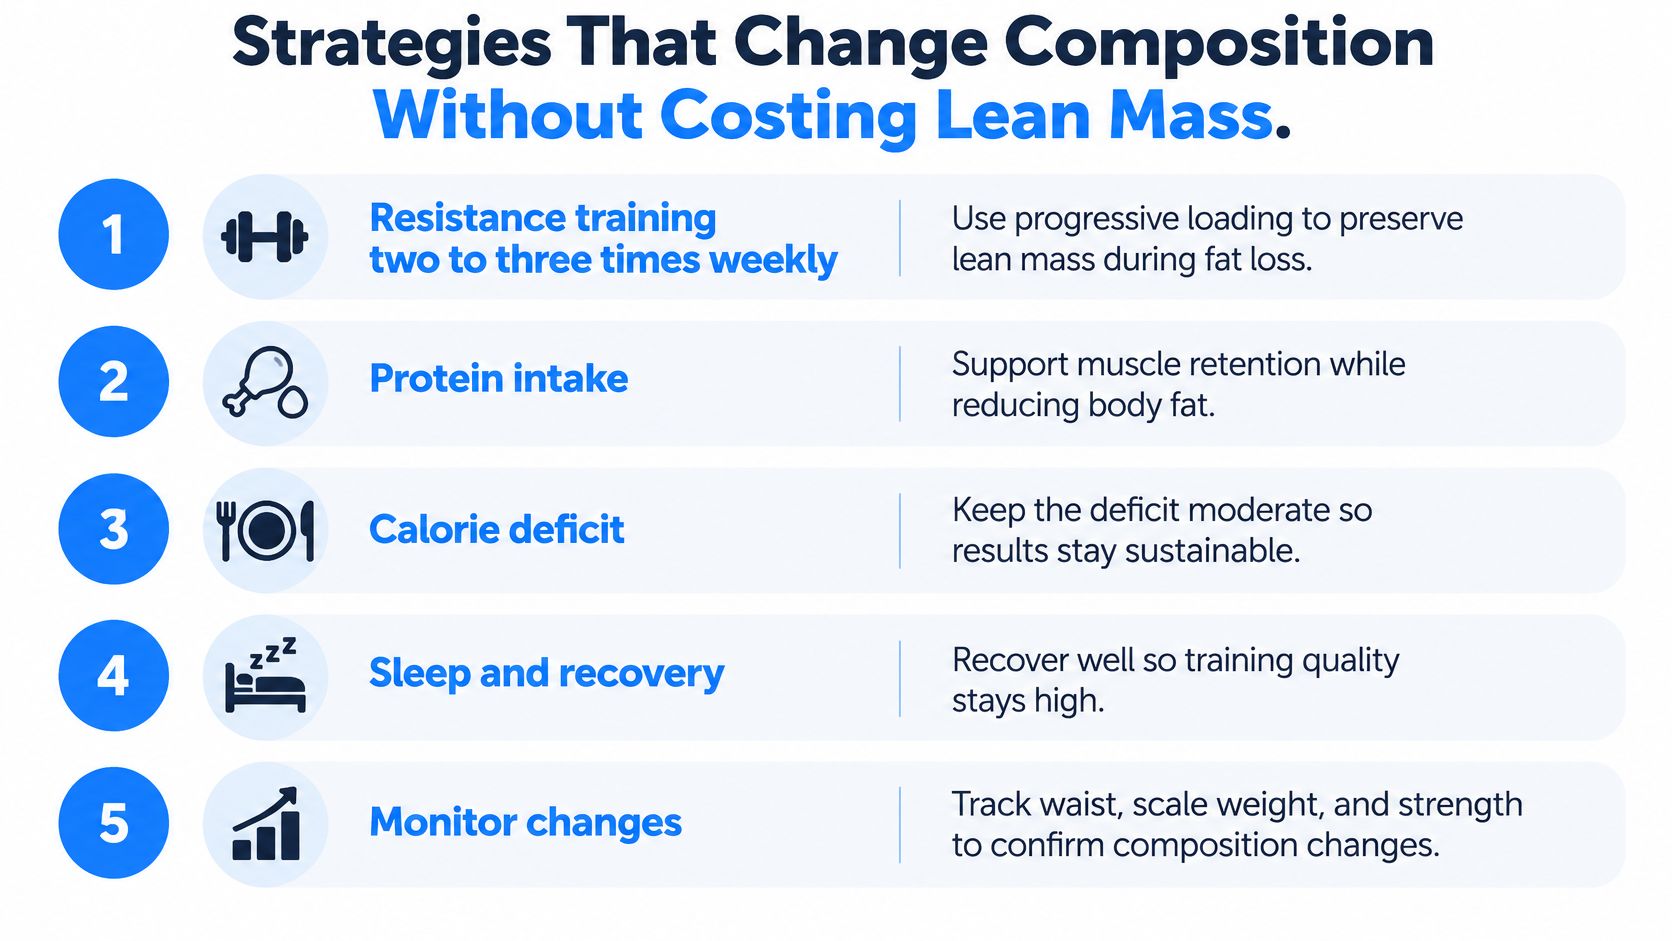
1. Resistance training. Two to three sessions a week, with progressive loading, gives muscle a reason to stay during an energy deficit. Track a few compound lifts. Falling loads are an early sign that the deficit, protein, or recovery is off.
2. Protein, spread through the day. Muscle protein synthesis responds to repeated doses, not one large dinner. Active men generally do better when each meal carries a solid protein serving and total intake matches training load. A clinician or registered dietitian should set the gram target from body size, kidney history, and appetite.
3. Aerobic work. Regular moderate-intensity activity supports visceral-fat reduction and improves blood pressure, glucose, and lipids. It does not replace lifting. It fills the days between strength sessions.
4. Sleep. Short sleep raises hunger and blunts training quality. Protecting a full night is part of the composition plan, not a lifestyle extra.
5. A modest calorie reduction. Severe restriction accelerates lean-mass loss and is hard to sustain. A clinician-planned deficit leaves room for protein and training. Recalculate intake as weight changes so the deficit does not deepen.
6. Clinically supervised medication, when it is appropriate. GLP-1 receptor agonists reduce appetite and slow gastric emptying through incretin pathways, and they are adjuncts to nutrition and activity, not replacements. A 2025 review found that these agents generally produce substantial fat-mass and visceral-fat reductions, with modest absolute declines in lean body mass. A separate 2025 systematic review of 36 randomized trials and 2,555 participants, discussed in Harvard Health's overview of body-fat interpretation, found reduced fat-related outcomes and lean-mass loss in most studies, especially with overweight or obesity and longer exposure.
What to do with a lean-mass change
Separate absolute lean mass in pounds or kilograms from lean mass as a percentage of body weight. Percentage lean mass can rise while absolute lean mass falls a little, because fat left faster than muscle. That pattern is different from rapid weakness.
A useful plateau is one where waist and fat mass keep falling, or at least do not rebound, while strength and lean-mass measures hold. An unhealthy stall is rapid weight loss, declining lifts, low intake, or fatigue that does not match the training plan. Those signs warrant a medical review, not a tighter diet. Men who have stopped seeing waist change can use a structured look at a weight-loss plateau before they assume the program has failed.
Prescription treatment, including compounded formulations, is written only at the clinical discretion of a licensed U.S. provider after an individualized telehealth intake. Trial averages describe studied products and studied populations. They are not a personal promise, and they do not transfer automatically to every compounded preparation.
Confirm Your Baseline and Choose the Next Step
Start with a baseline that can be repeated, not a single impressive number.
- Composition: one estimate from a method you can repeat, with the device and conditions written down.
- Waist: the same landmark as the last section's protocol.
- Blood pressure: a rested reading, not one taken after caffeine or a workout.
- Glucose: fasting glucose or HbA1c.
- Lipids: triglycerides and HDL cholesterol at minimum.
Repeat the set under the same conditions every 8 to 12 weeks. That interval is long enough for fat and strength to move, and short enough to catch an overly aggressive deficit.
When to seek review sooner
Prompt clinical review is warranted when waist is at or above 102 cm and blood pressure or glucose is already high, when weight is dropping fast without a clear plan, when strength is falling, when intake stays very low, or when a new blood-pressure medicine is added. Those are safety checks, not cosmetic ones.
Men considering medically supervised weight management start with an individualized telehealth intake and a consultation with a U.S.-licensed clinician. Treatment follows only if it is clinically appropriate. Vials + Vitals provides that intake for physician-directed metabolic protocols. Prescription treatments and compounded formulations are prescribed strictly at the clinical discretion of licensed U.S. healthcare providers following an individualized telehealth intake and consultation. A metabolic calorie calculator can frame the nutrition side of the same conversation. It does not replace the intake.
Informational purposes only. Compounded medications are evaluated by a licensed provider for individual suitability and are fulfilled by state-licensed partner compounding pharmacies.
Vials + Vitals offers physician-directed telehealth for metabolic care, including GLP-1 protocols that are prescribed only after a U.S.-licensed clinician reviews an individual intake. If waist, body-fat trend, and metabolic markers suggest you need a supervised plan rather than another scale reading, visit Vials + Vitals to start that clinical assessment.